Dashboard
The first screen shown immediately after login. The URL path is /dashboard. It collects quick-jump shortcuts to frequently used screens and widgets summarizing your activity.
One URL, but the widgets and quick-action buttons differ depending on the role of the logged-in account. Standard Users and Agent Developers see different layouts, and the System Administrator / Governance Officer variants are covered separately in the Admin Manual · Dashboard chapter.
Layout (Shared Skeleton)
The dashboard has three parts: the welcome message at the top, the left widget grid, and the right fixed support panel. The skeleton is the same for every role; only the widgets and buttons inside change based on permissions.
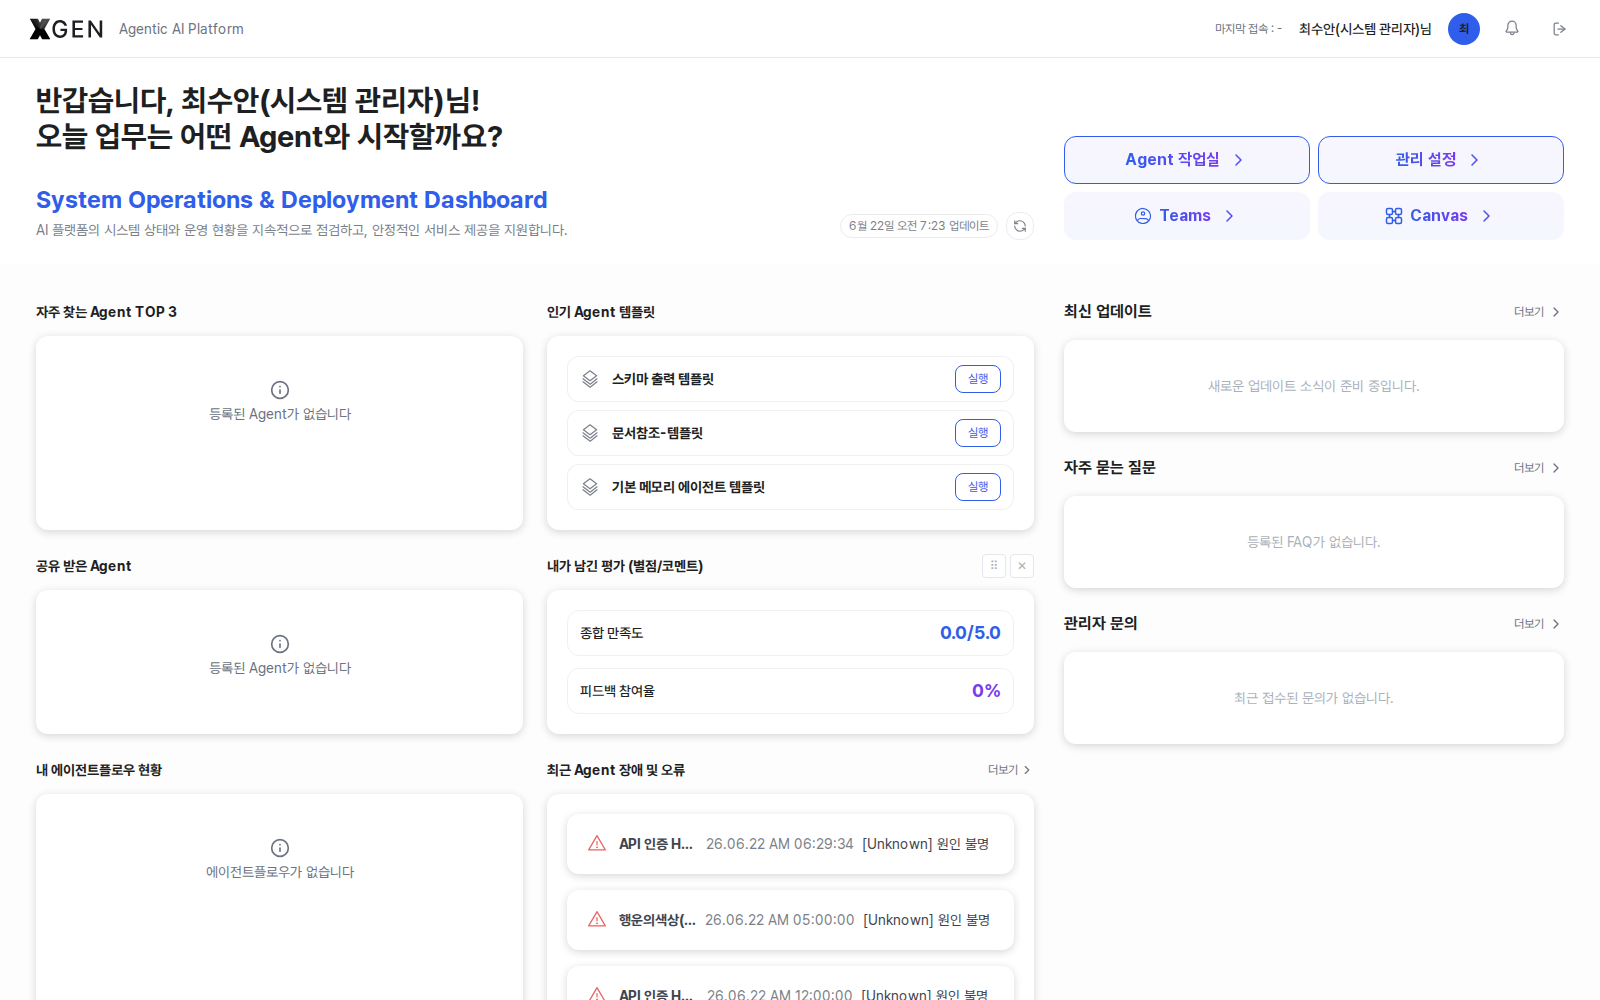
Welcome Message and Quick Navigation
The card opens with "Welcome, OOO! Which Agent would you like to start today's tasks with?" Two quick-jump buttons appear to its right, and only the ones your permission covers are active.
| Button | Where it goes | Standard User | Agent Developer |
|---|---|---|---|
| Agent Workspace | /main → auto-redirects to ?view=canvas-intro (Agent design intro) |
Enabled — but the page body is empty without Agent-build permission (see note below) | Enabled — intro content (Start with chat / Start from blank canvas / Continue + Canvas & live-chat sections) is rendered normally |
| Admin Center | /admin |
Disabled | Disabled |
To see the Admin Center button active, refer to the Admin Manual · Dashboard chapter.
Right Fixed Panel
Always shown in the same position regardless of widget grid customization. The panel contains three items; labels below match the live solution screen.
| # | Panel label | Source | More link |
|---|---|---|---|
| 1 | Latest Updates | 3 most recent notices | /main?view=support-notices |
| 2 | FAQ | Top 3 by views | /main?view=support-faq |
| 3 | Admin Inquiries | Your 1:1 admin inquiries (empty state: "No inquiries to the administrator yet.") | /main?view=support-qna |
Use the More > link in each panel header to navigate to the full list.
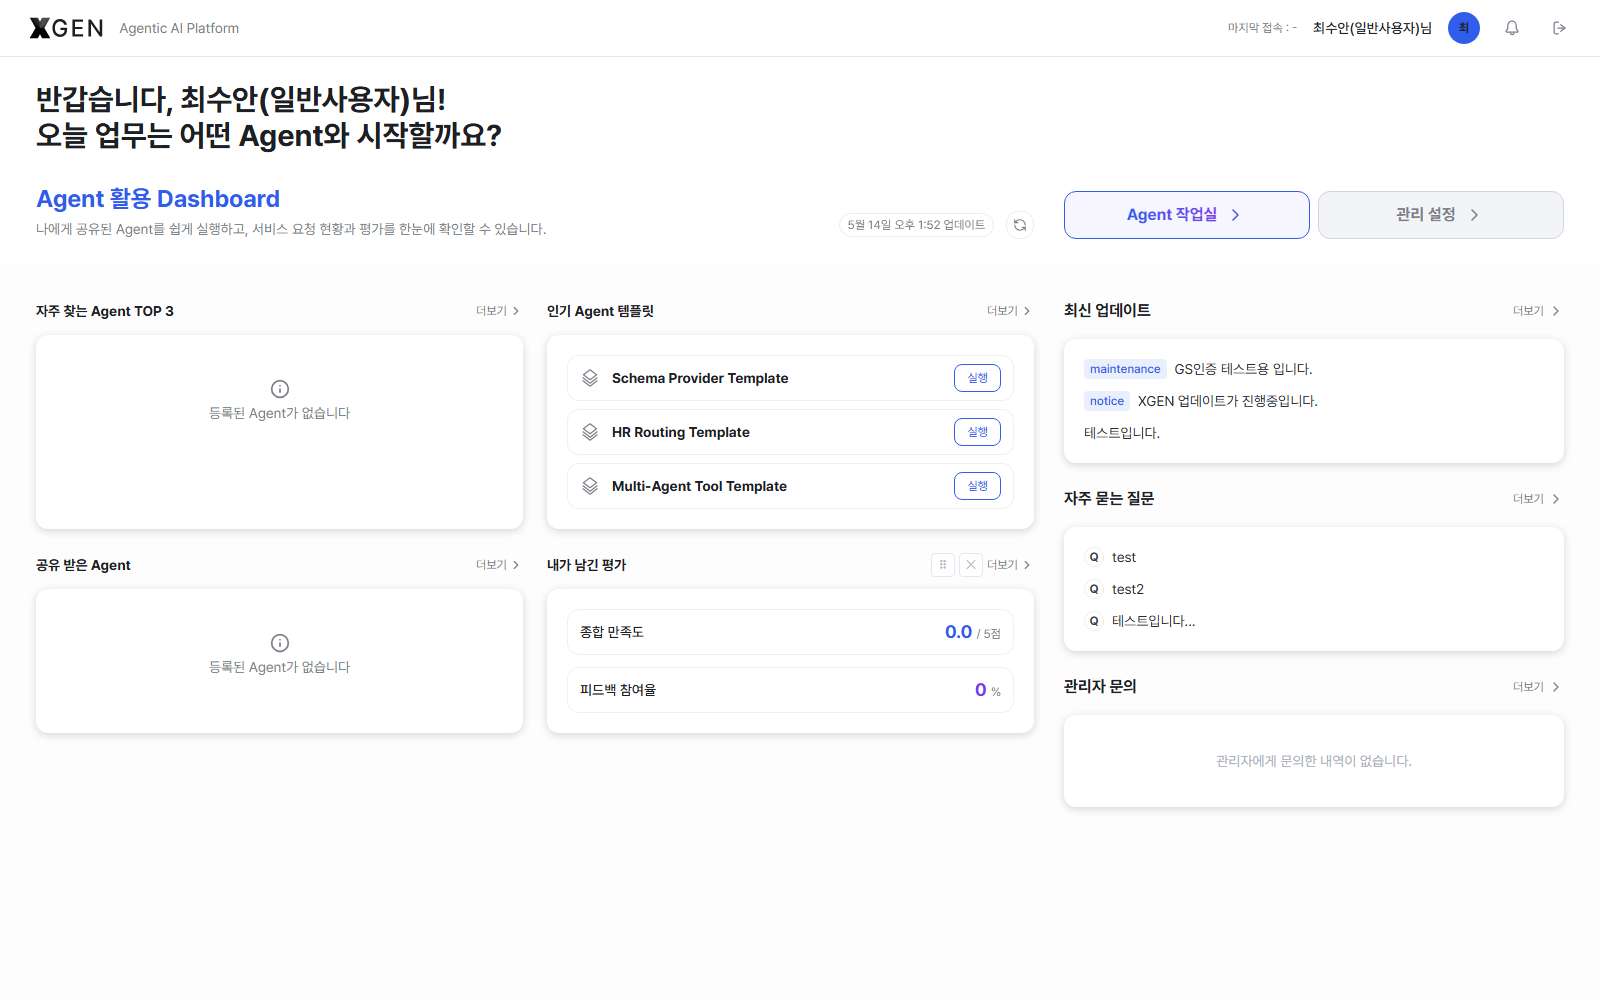
Standard User View
The main screen for users who consume the agents the organization has already deployed, via chat. The greeting subtitle reads "Agent 활용 Dashboard" with the helper text "Easily run agents shared with you and review service-request status and feedback at a glance."
| Widget | Contents |
|---|---|
| Top 3 Frequent Agents | Top 3 agents you call most often |
| Popular Agent Templates | Templates with the most views / clones |
| Shared With Me | Agents that other users have shared with you |
| My Feedback | Your overall satisfaction score and feedback-participation rate summary |
If the widgets look empty they will fill in as your activity accumulates.
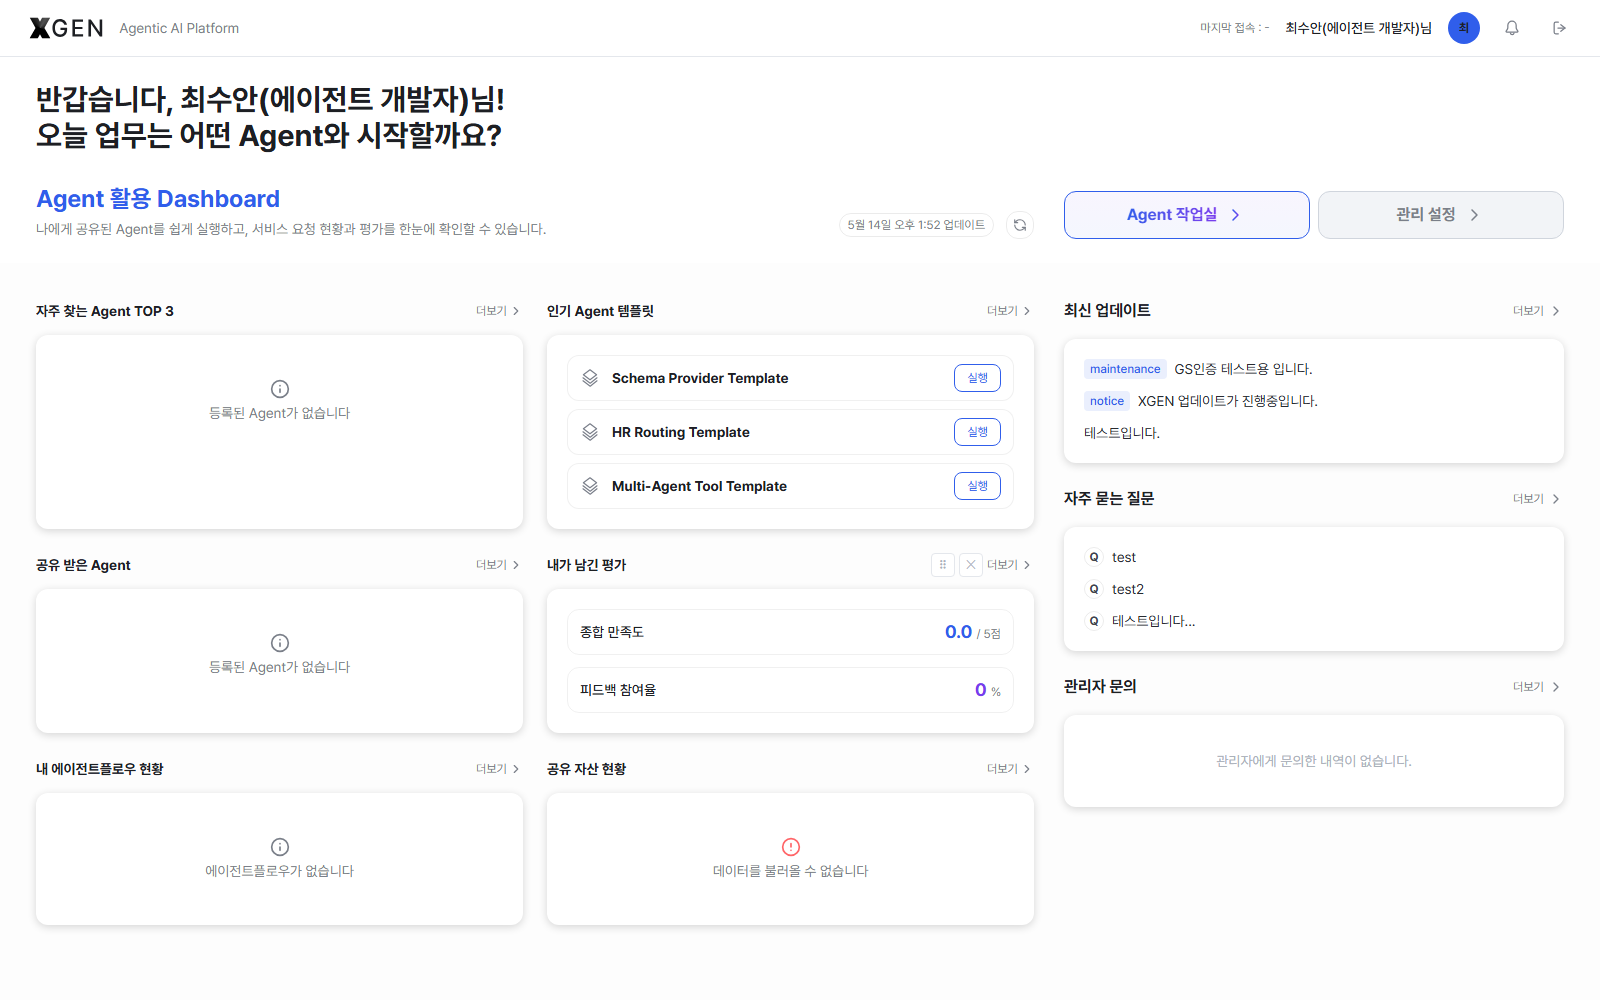
Agent Developer View
The main screen for users who build and deploy agents themselves. The greeting subtitle is the same "Agent 활용 Dashboard" as the Standard User view, with My Agentflow Status and Shared Assets widgets added to the grid.
| Widget | Contents |
|---|---|
| Top 3 Frequent Agents | (Shared) Agents you call most often |
| Popular Agent Templates | (Shared) Templates with the most views / clones |
| Shared With Me | (Shared) Agents shared by other users |
| My Feedback | (Shared) Your feedback summary |
| My Agentflow Status | Total / shared / deployed counts and recent items for your agentflows |
| Shared Assets | Summary of tools, knowledge collections, etc. you have shared |
The My Agentflow Status widget may be empty right after first deployment until data accumulates. Use it as a shortcut into Agent Operations.
Customizing Widgets
- Hide: click the Hide button on a card's top-right.
- Reorder: drag a card to a new position (powered by
@dnd-kit/sortable). - Add widget: open the Add widget dropdown at the top to bring back hidden widgets.
- Reset: click Reset at the top to restore the default widget list and order.
These settings are saved per user and do not affect other users.
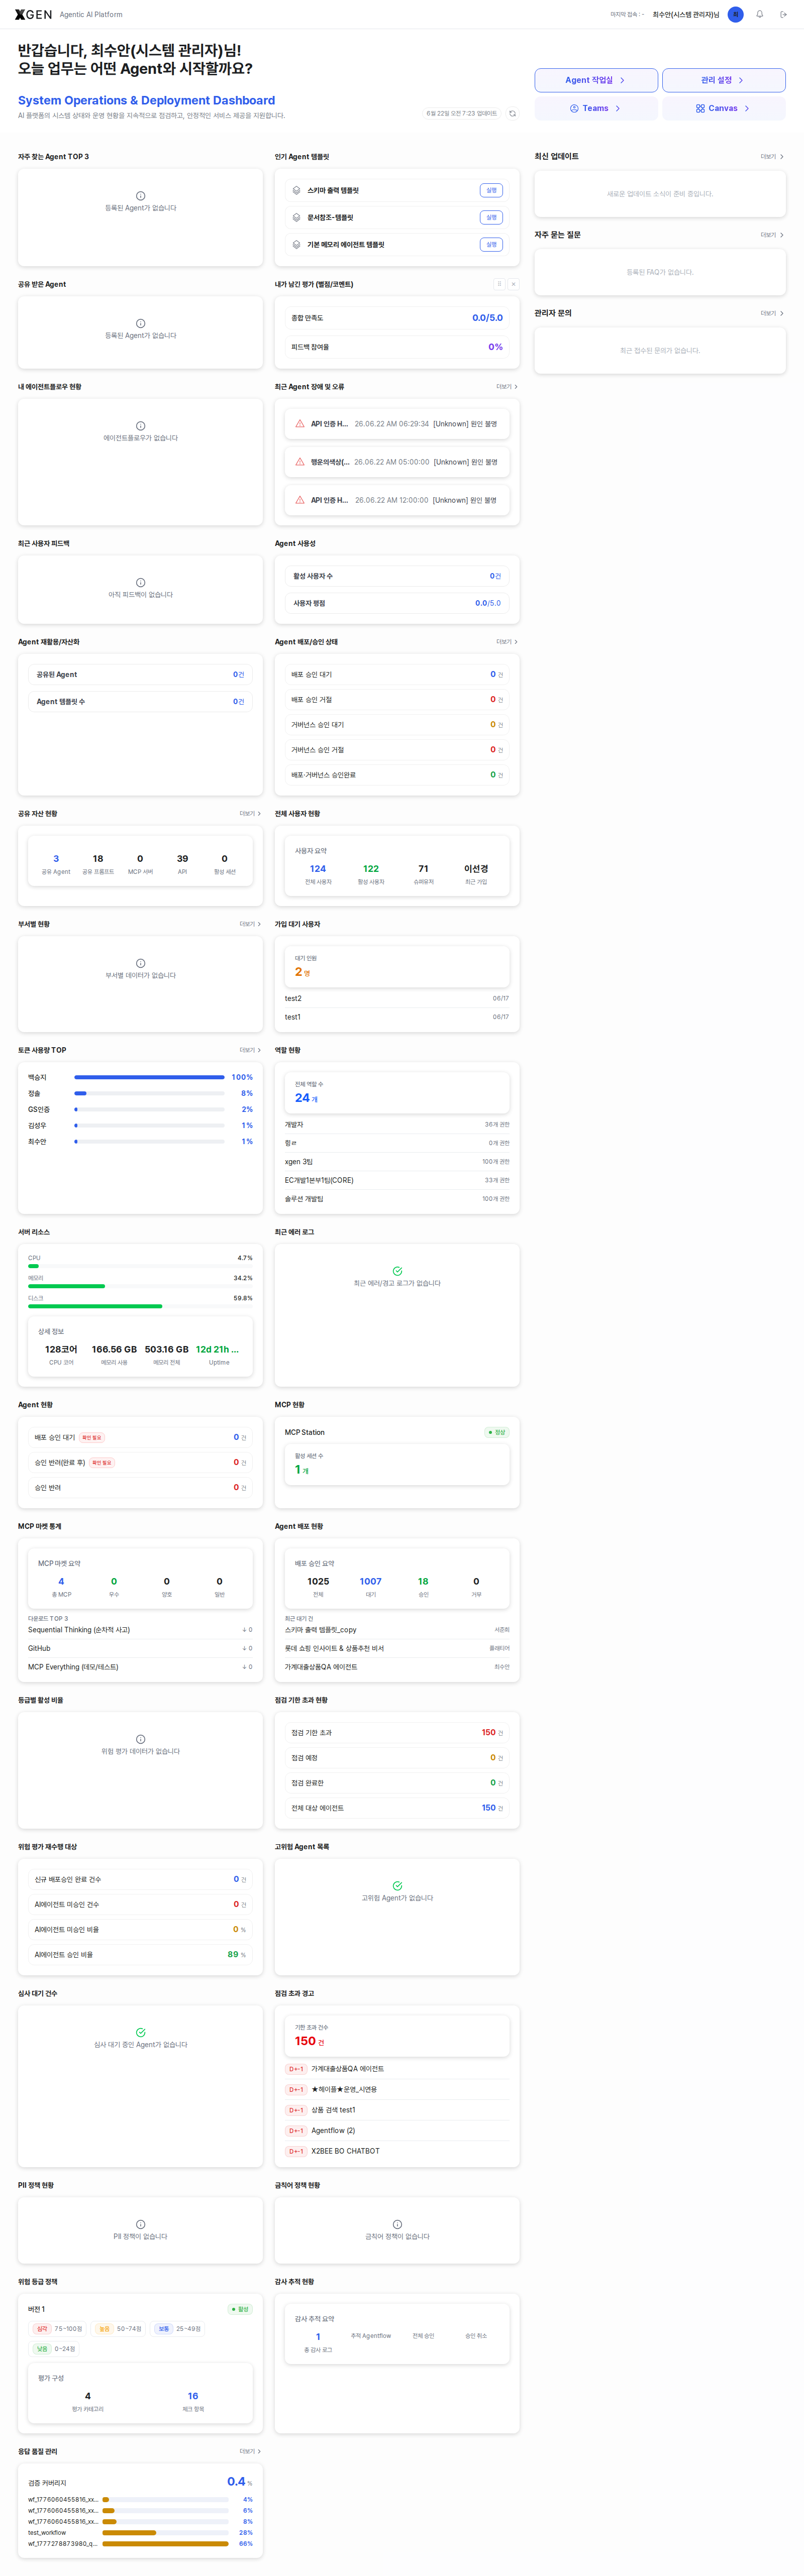
A full-page scroll of the dashboard:
Usage Flow
- You land on
/dashboardautomatically after login. Click the XGEN logo in the top-left to return from other screens. - Use Top 3 Frequent Agents to jump straight into a familiar agent.
- Recommended flow: scan Latest Updates and FAQ on the right panel first — you'll catch system changes and common issues before starting work.
- Hide unused widgets via Hide; bring them back via Add widget when needed.
- Drag cards to reorder; click Reset to undo all customization.
Common Issues
- My widgets are empty — they fill in over time as your activity accumulates. "Top 3 Frequent Agents" only appears after you call some agents.
- My layout differs from a colleague's — widget visibility, order, and hidden state are saved per user. The base widget list itself also differs between Standard Users and Agent Developers — both share the "Agent 활용 Dashboard" subtitle, but Agent Developers see additional widgets for the assets they own.
Related Chapters
- Dashboard (Admin View) — additional widgets and operational usage for System Administrators and Governance Officers.
Inquiries
For dashboard-related questions, email the Xgen Solution Administrator.