System Monitor
This chapter describes how to monitor the resource state (CPU, memory, disk, network, etc.) of the solution server and configure thresholds. (Depending on the operational environment, a Grafana-based integrated monitoring view may also be available.)
System Overview
Select Admin → System Status → System Monitoring in the left sidebar.
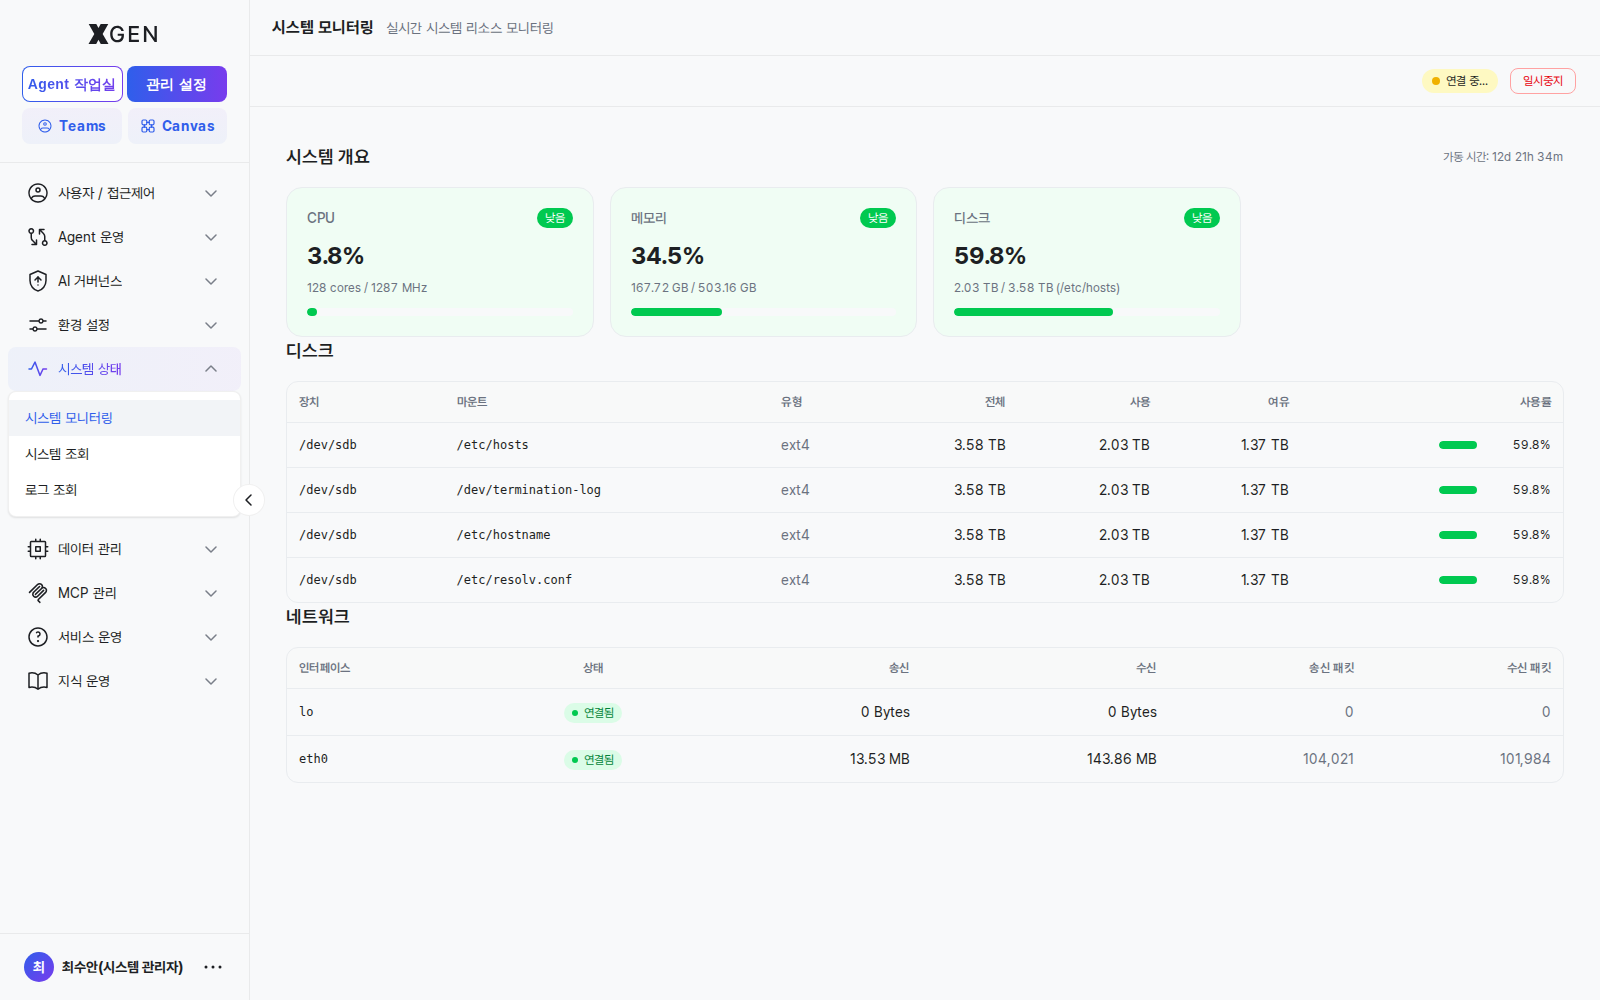
The following information is displayed in real time.
| Metric | Korean | Items Shown |
|---|---|---|
| CPU | CPU | Per-core utilization (%), average, peak |
| Memory | 메모리 | Used / free / total (GB), utilization (%) |
| Disk | 디스크 | Per-partition used / free / utilization |
| Network | 네트워크 | Tx / Rx (MB/s), connection state |
| Uptime | 가동 시간 | Time elapsed since boot |
The Pause / Resume buttons at the top control screen refresh (server-side monitoring continues regardless).
Utilization Levels
Each metric's utilization is color-coded into four levels.
| Level | Korean | Color | Meaning |
|---|---|---|---|
| Low | 낮음 | Green | Plenty of headroom |
| Medium | 보통 | Yellow | Normal range |
| High | 높음 | Orange | Caution |
| Critical | 위험 | Red | Immediate action required |
Default thresholds, adjustable per environment:
| Metric | Medium | High | Critical |
|---|---|---|---|
| CPU | 60% | 80% | 90% |
| Memory | 70% | 85% | 95% |
| Disk | 70% | 85% | 95% |
Configuring Thresholds
- Click the Settings (⚙) button at the top right of System Monitor
- Adjust the per-metric threshold sliders
- Notification Channel — select where to send threshold alerts (email, webhook, etc.)
- Save
Ignoring Brief Spikes
Brief spikes from batch jobs or sudden user surges are normal. Configuring Critical alerts to fire only when sustained for over an hour reduces noise.
Resource History
The Resource History tab shows time-series charts for past trends.
| Period Option | Data Resolution |
|---|---|
| Last 1 hour | 1-second granularity |
| Last 24 hours | 1-minute granularity |
| Last 7 days | 5-minute granularity |
| Last 30 days | 1-hour granularity |
When investigating spikes, cross-reference the audit log around the same time to infer causes.
System Inspection
Select Admin → System Status → System Inspection in the left sidebar. The screen header reads "Service status and version compatibility" and the page lists health-check results for every backend service the solution depends on.
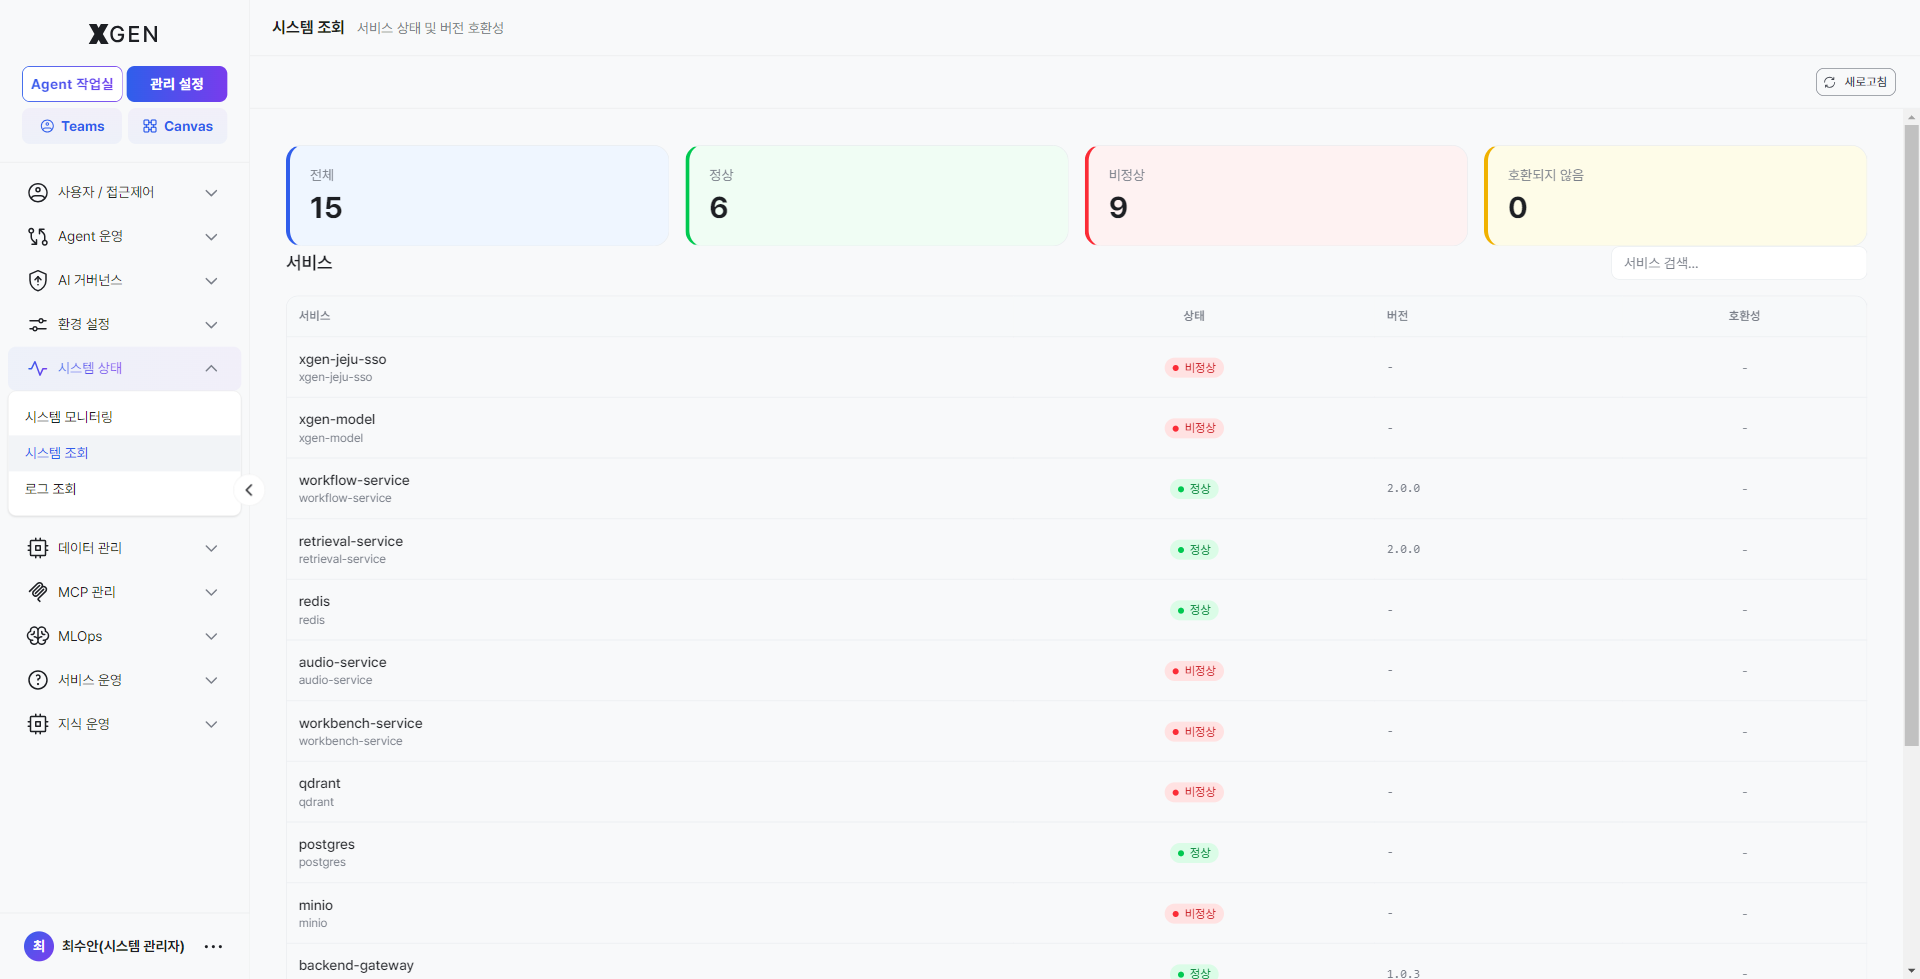
Screen layout
| Area | Location | Description |
|---|---|---|
| Refresh button | Top-right | Runs the health check again immediately. |
| Card — Total | Top gray | Total number of monitored services. |
| Card — Healthy | Top green | Services that responded successfully on the latest health check. |
| Card — Unhealthy | Top red | Services that did not respond or returned an error — anything other than 0 needs immediate attention. |
| Card — Incompatible | Top yellow | Services that responded with a version different from what the solution expects. |
| Service search input | Body top-right | Filter the list instantly by service name. |
| Service table | Body | One row per service — Service / Status / Version / Compatibility columns. |
Service table columns
| Column | Description |
|---|---|
| Service | Backend component name the solution depends on (e.g., workflow-service, retrieval-service, qdrant, postgres, redis, audio-service, xgen-model). |
| Status | Latest health-check result. Green Healthy / red Unhealthy badge. |
| Version | Reported version string (e.g., 2.0.0). - if not reported. |
| Compatibility | Whether the version matches what the solution requires. - if not reported. |
Usage scenarios
- First check during an outage — When users report issues (e.g., no chat response, embedding errors), open this screen first and confirm whether the Unhealthy card is non-zero.
- Post-deployment verification — After a release or infrastructure operation, refresh to confirm that all services have returned to healthy.
- Version-compatibility tracing — If Incompatible is non-zero, use the Version column to identify which services are off-version and share with the infrastructure team.
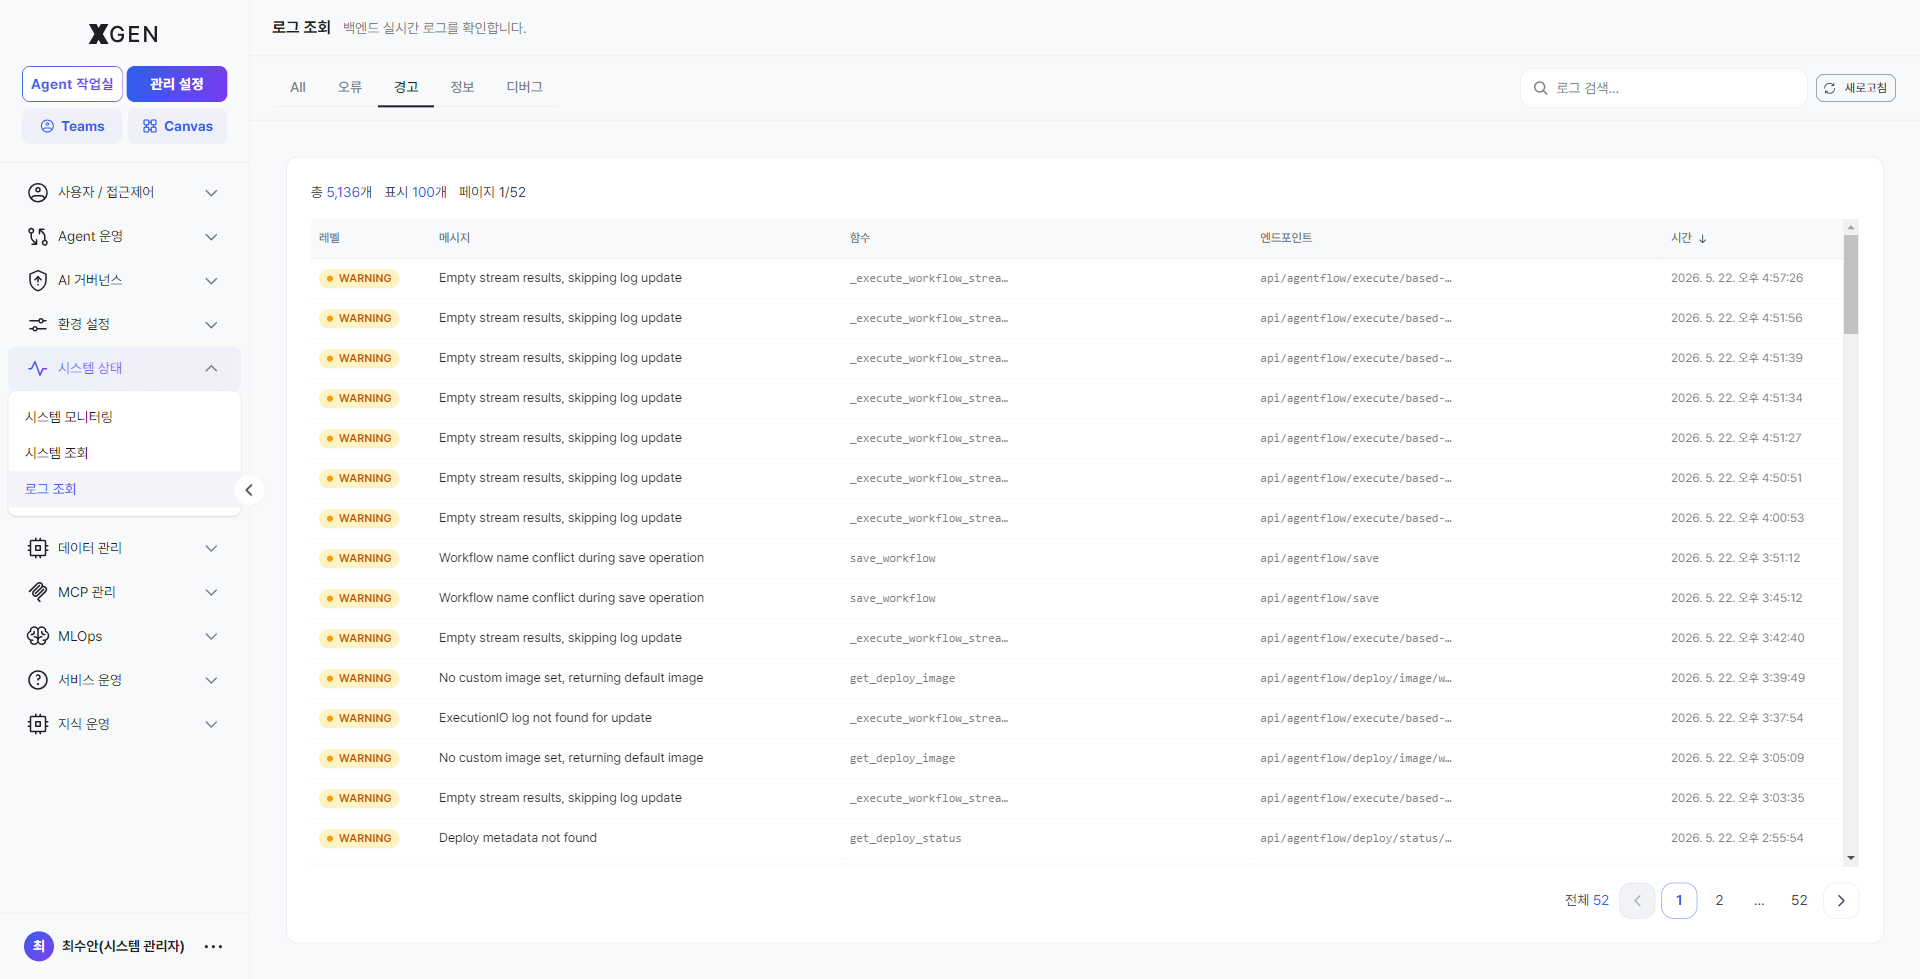
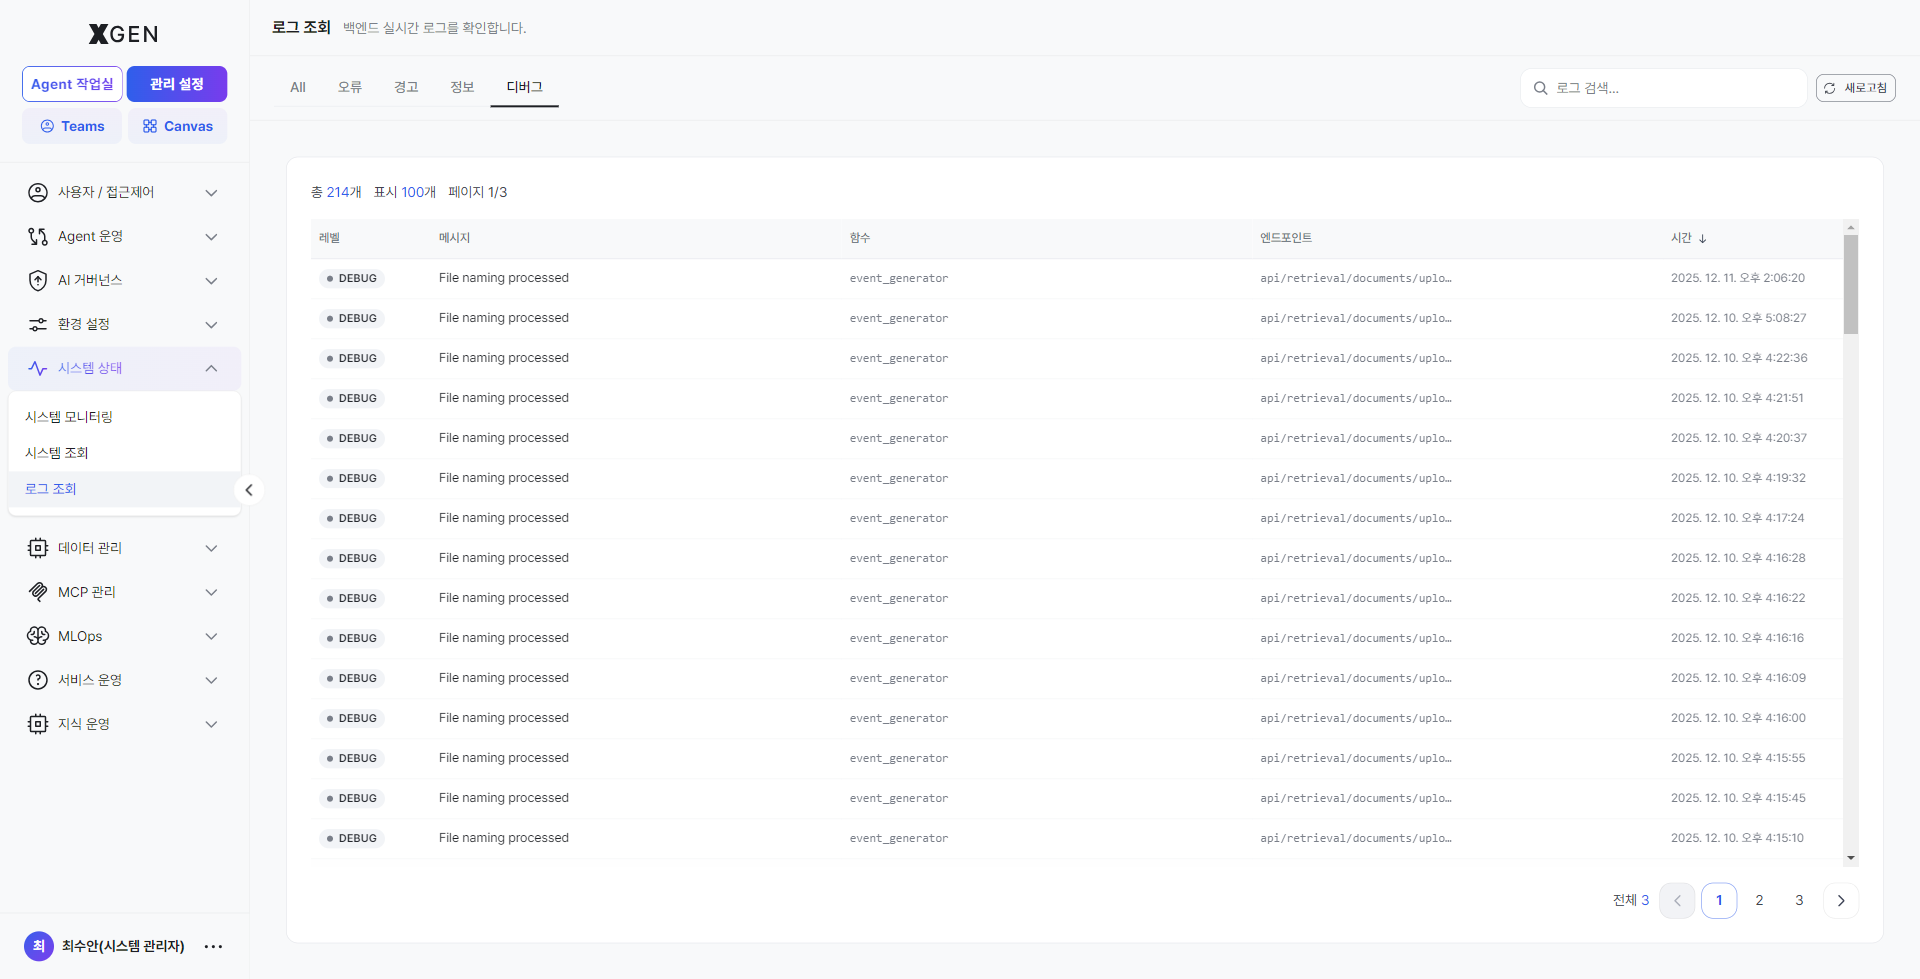
Log Viewer
Select Admin → System Status → Log Viewer in the left sidebar. Technical logs emitted by backend services can be searched and filtered by level.
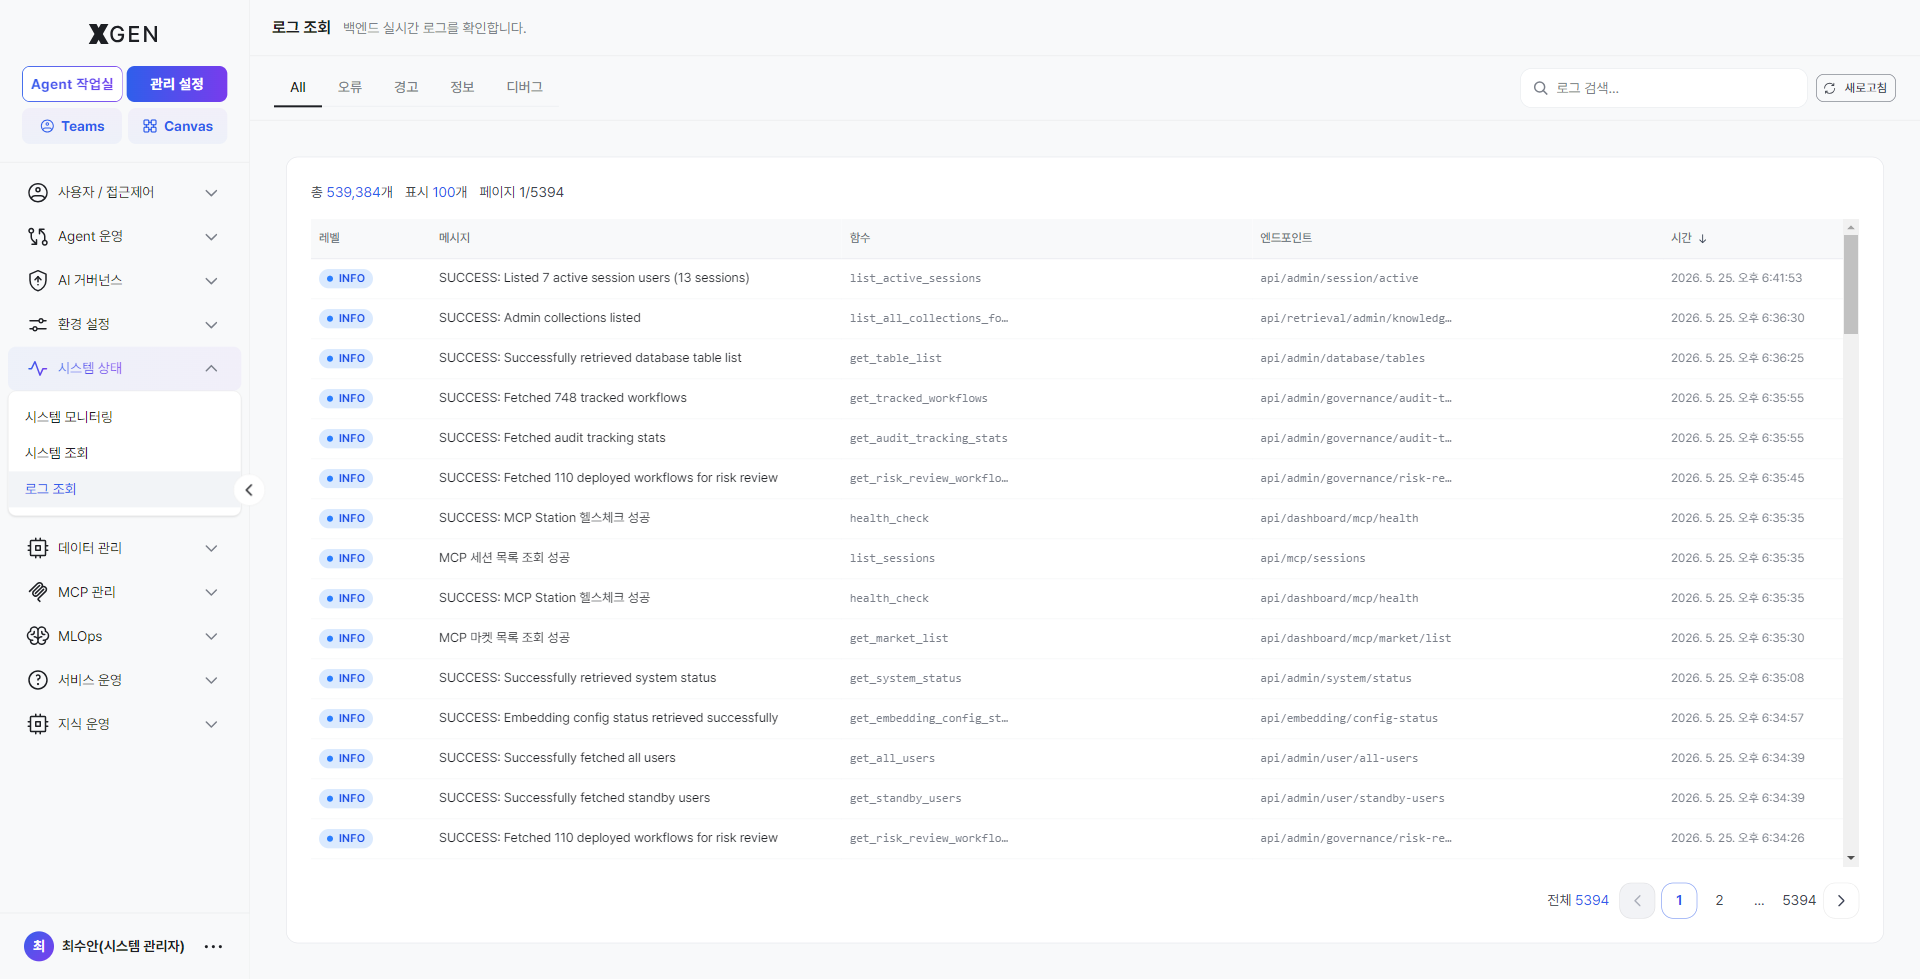
Screen layout
| Area | Location | Description |
|---|---|---|
| Tab — All | Top-left (default) | All log levels in chronological order. |
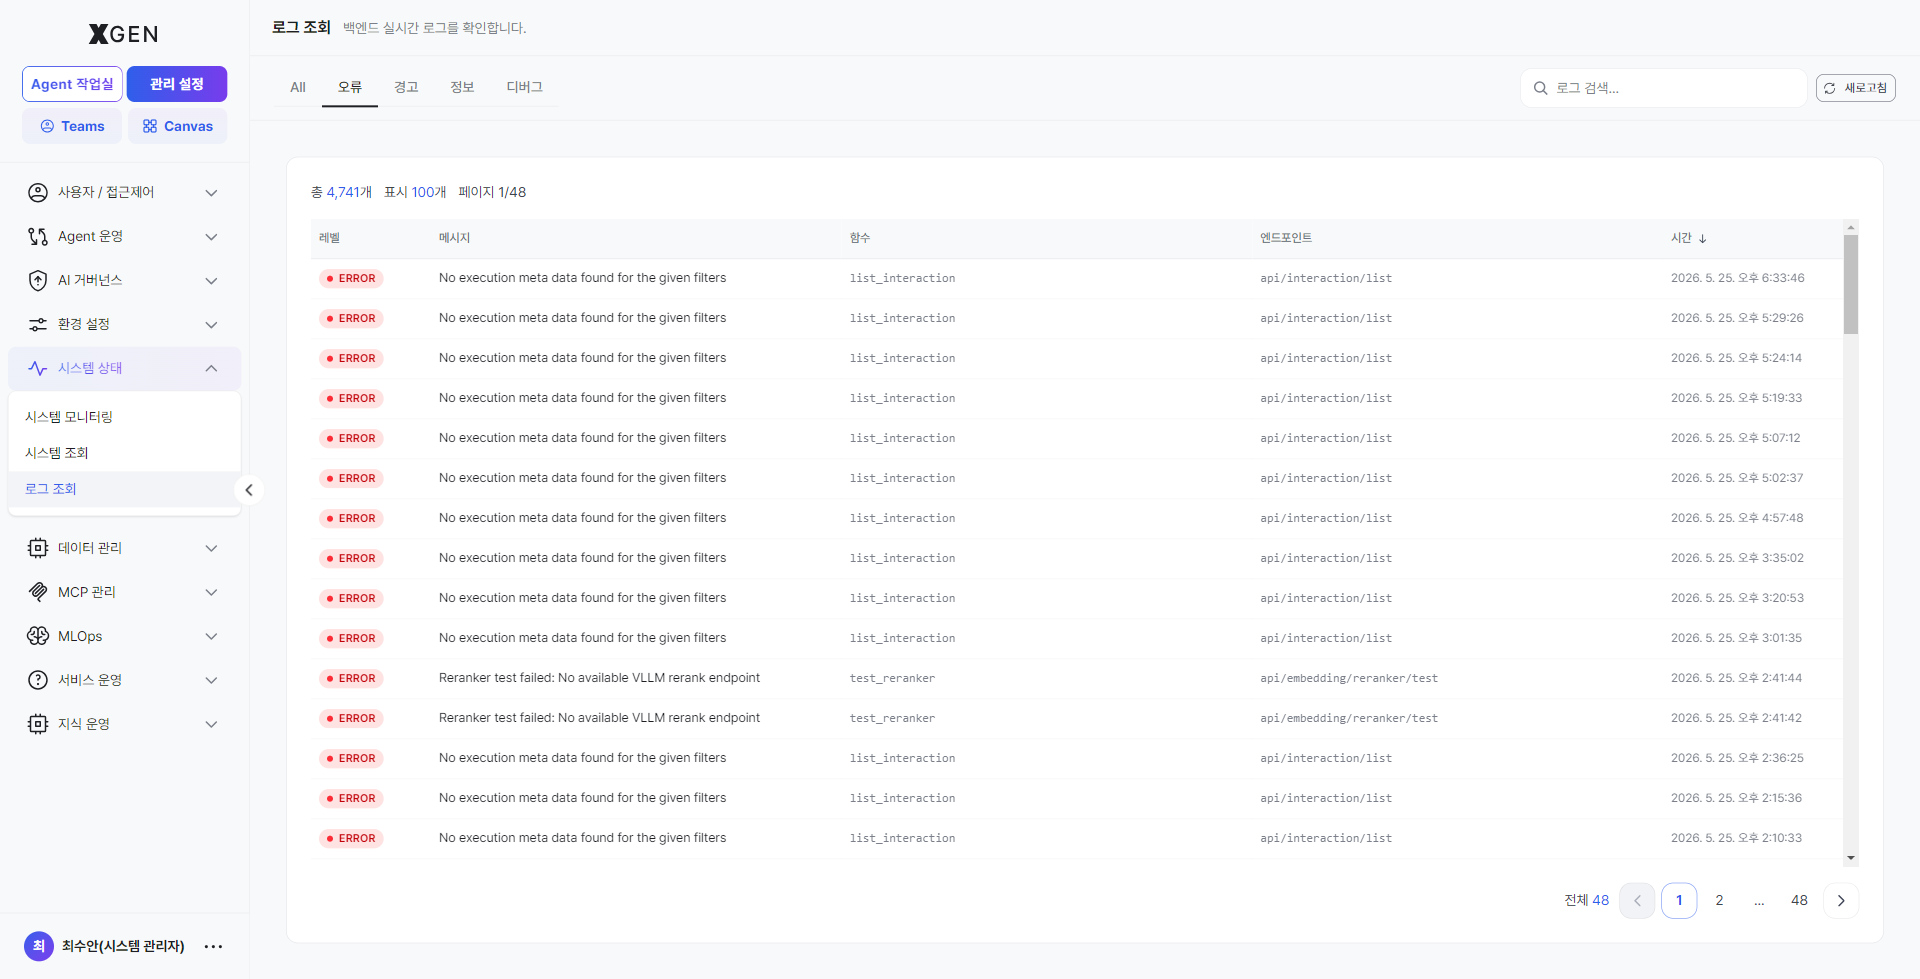
| Tab — Error | Second | System errors and exceptions only — first stop when tracing an incident. |
| Tab — Warn | Third | Potential risk signals (succeeded but with anomalies). |
| Tab — Info | Fourth | Normal-flow informational logs (e.g., request handled). |
| Tab — Debug | Fifth | Detailed development / analysis logs. Normally disabled in production, enabled only in diagnostic mode. |
| Log search input | Top-right | Instant filter by message or service. |
| Refresh button | Top-right | Reload latest logs immediately. |
Log table columns
| Column | Description |
|---|---|
| Level | ERROR / WARN / INFO / DEBUG shown as a colored badge. |
| Message | Log body (e.g., Successfully retrieved system status, No execution data found for the given filters). |
| Source | Identifier of the originating service / module (e.g., get_system_status, workflow_processor). |
| Details | Call path, trace context, and other metadata. |
| Time | Timestamp (second granularity). Click the column-header ↓ to toggle sort direction. |
Per-tab usage guide
All
All log levels shown in chronological order. Use this at the start of analysis to view the time-line context as a whole, or to see logs around an error event.
Error (ERROR)
System errors and exceptions only. Check at least once a day; trace causes of new ERRORs as soon as they appear and cross-reference with user reports. Rows are tagged with a red ERROR badge.
Warn (WARN)
Potential risk signals (succeeded but with anomalies). Review weekly — accumulating warnings can foreshadow incidents, so watch for trends.
Info (INFO)
Normal-flow informational logs (e.g., request handled). Use to trace a specific request's normal flow or confirm that an expected call happened.

Debug (DEBUG)
Detailed development / analysis logs. Noisy in production; enable only when reproducing a specific issue and return to normal level once diagnosis is done.
vs. Audit Log
- Log Viewer: technical logs from backend components (stack traces, processing-result messages). Used by operations to chase incidents.
- Audit Log: a permanent record of who did what when (user activity). Used for regulatory and internal-audit response. For data-change audits, see Data Management · Data Audit Log.
Operational recommendations
- Standard incident-response flow — Use System Inspection to identify the unhealthy service → switch to Log Viewer → Error tab for the same time window → forward the message and source to the infrastructure team.
- Turn DEBUG off after use — Debug-level logs put pressure on disk usage and search performance. Return to normal level as soon as diagnosis is done.
- Standardize search keywords — Share common keywords (service names, exception classes) across the team so investigations converge quickly.
Operational Recommendations
- Weekly review — Inspect the 30-day chart on Resource History weekly. Disks fill gradually, so weekly checks are essential.
- Watch for unplanned restarts — Abnormally short uptime (e.g., under one day) suggests an unplanned restart. Check the audit log for cause.
- Periodic threshold recalibration — Baseline utilization rises with user growth. Reassess threshold appropriateness quarterly.
Contact
For questions about System Monitor, please contact the Xgen Solution Administrator.