Dashboard (Admin View)
The /dashboard screen you land on after login is shared by all users, but accounts with admin permissions see additional governance / operations widgets and have the Admin Center quick-jump button enabled.
Refer to User Manual · Dashboard first for layout fundamentals and widget customization. This chapter covers the admin-only additions, split into the System Administrator view and the Governance Officer view.
Shared Across Both Admin Roles
Admin Center Button Enabled
The two quick-jump buttons at the top-right of the dashboard — Agent Workspace and Admin Center — are simplified to those two only, and the Admin Center button is enabled for any admin account.
| Button | Where it goes | Standard User / Agent Developer | Admin |
|---|---|---|---|
| Agent Workspace | /main → auto-redirects to ?view=canvas-intro (Agent design intro) |
Standard Users may see the body as empty (permission gating — see the Standard User warning in User Manual · Quick-jump). Agent Developers see the full intro. | Full intro rendered (Agent-build permission included) |
| Admin Center | /admin |
Disabled | Enabled (entry to all admin screens: users, roles, LLM, governance, etc.) |
After entering
/admin, use the left sidebar to navigate to AI Model Management, AI Governance, Users / Access Control, Environment, and other detailed areas.
Welcome Message Subtitle
Both System Administrators and Governance Officers see the welcome subtitle "System Operations & Deployment Dashboard" with the helper text "Continuously monitors AI platform health and operational status, supporting reliable service delivery." (Standard Users and Agent Developers see "Agent 활용 Dashboard" instead — see User Manual · Dashboard.)
Right-Panel Interpretation Differs
The right fixed panel contains the same three items as the user view (Latest Updates / FAQ / Admin Inquiries). For administrators, however, the Admin Inquiries panel is read as a queue of incoming items to handle rather than a view of one's own inquiry history — it surfaces the 1:1 inquiries the admin must respond to. The panel layout itself matches the user-side description in User Manual · Right Fixed Panel, where the three labels and data sources are documented.
Difference from earlier specs
Earlier specs and prior versions of this manual mentioned a "Recent Service Requests TOP 3" panel for admins, but it is not exposed on the current live solution build for either user or admin accounts. The queue of items to handle is consolidated into the single Admin Inquiries panel.
System Administrator View
The main screen for operators of solution infrastructure, users, authentication, and LLM connections.
Operations Widgets
On top of the Standard User / Agent Developer widgets, operations and deployment widgets are added.
| Widget | Contents |
|---|---|
| Top 3 Frequent Agents / Popular Agent Templates / Shared With Me / My Feedback | (Shared) Agent-usage widgets |
| My Agentflow Status | Total / shared / deployed counts and recent items for your agentflows |
| Recent User Feedback | Recent feedback entries left by standard users |
| Agent Deployment / Approval Status | Per-stage counts of deployed and pending agents |
| Shared Assets | Tools, knowledge collections, etc. shared by you or the organization |
Operations widgets require System Administrator permissions (
admin.system:*family). When someone reports "I can't see the widget," check permission grants first.The image below is a full-page scroll of
/dashboardviewed by the System Administrator account. Operations widgets extend well past one viewport — so this is captured with the page fully scrolled.
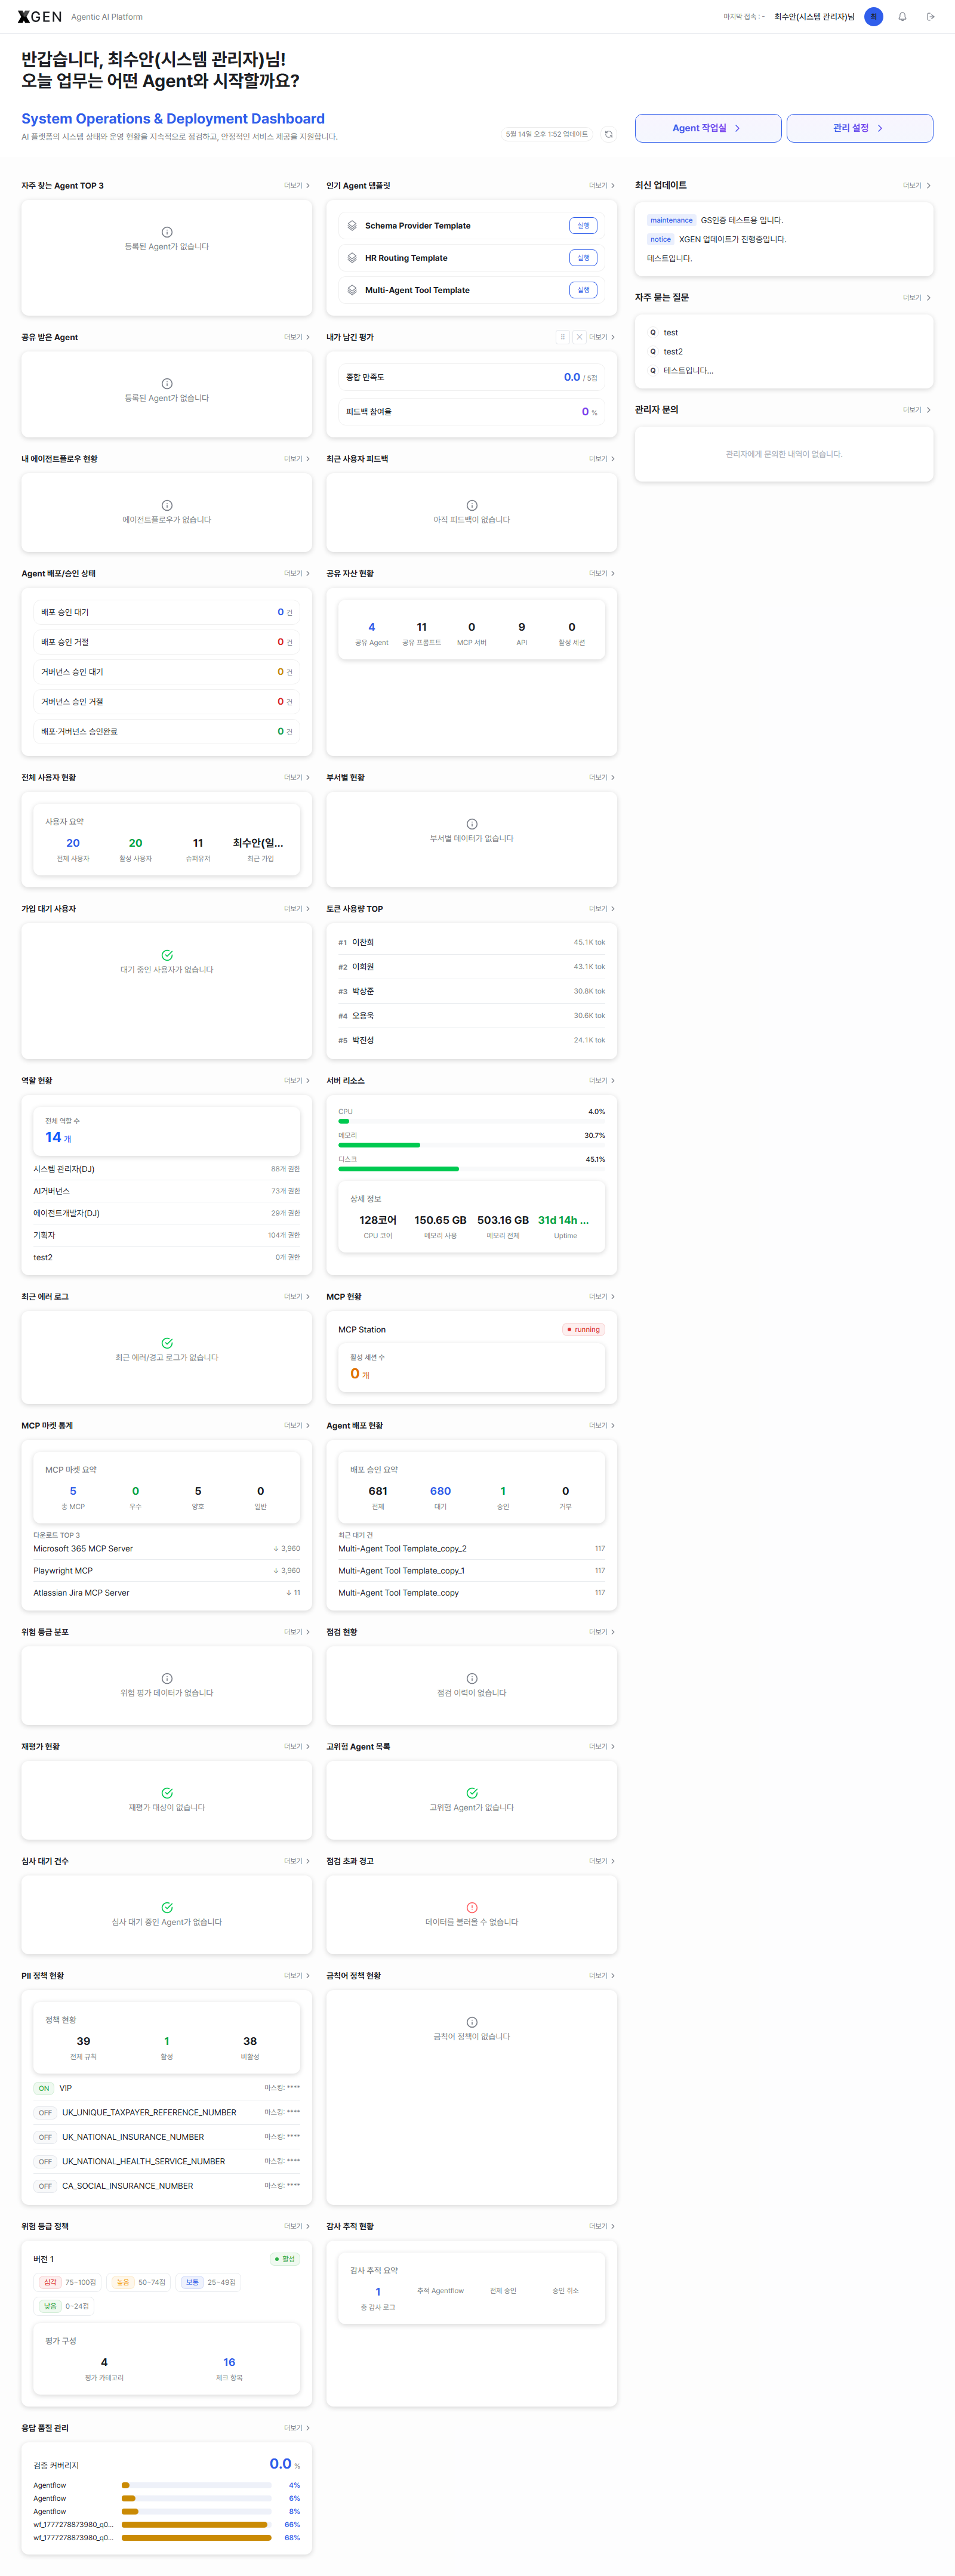
Operational Usage
- Daily system health check — Once a day, inspect threshold-exceeding items in the widget directly below the welcome message. If alerts are missing, review System Monitor alert settings.
- Shortcut entries reduce friction — Use the Admin Center button to enter all admin screens (permission grants, LLM registration, etc.) in one step.
- Catch high-impact issues quickly — Scan the right panel's Latest Updates (all-user notices) and the count of new items in the Admin Inquiries panel to surface user-impacting issues.
- Share a recommended widget layout — When onboarding a new admin, recommend: in their account, Reset → arrange the recommended widget configuration → screenshot it into operations docs (widget settings are per-user; forced sync is not supported).
Governance Officer View
The main screen for users responsible for risk, control, and audit of AI usage. Permissions are typically separated from the general system administrator, and governance-only widgets surface on the main screen.
Governance-Only Widgets (requires admin.governance:*)
On top of the System Administrator operations widgets, the following governance-policy and evaluation widgets appear toward the bottom of the page.
| Widget | Contents |
|---|---|
| PII Policy Status | Total / Active / Inactive counts of registered PII policies, plus top policy names (e.g., 39 / 1 / 38) |
| Forbidden-Word Policy | Total / Active / Inactive counts of registered forbidden-word entries |
| Risk Level | Whether the risk-level policy is active and the grade ranges (critical/high/medium/low) |
| Risk Evaluation Status | Number of top-level principles and evaluation items (e.g., 4 principles / 16 items) |
| Response Quality Score | Distribution of response-quality scores for deployed agents |
These widgets only appear in the widget grid for accounts with admin.governance:*. Without the permission they are not even listed.
The image below is a full-page scroll of
/dashboardviewed by the Governance Officer account. The widgets do not fit in one viewport — so this is captured with the page fully scrolled.
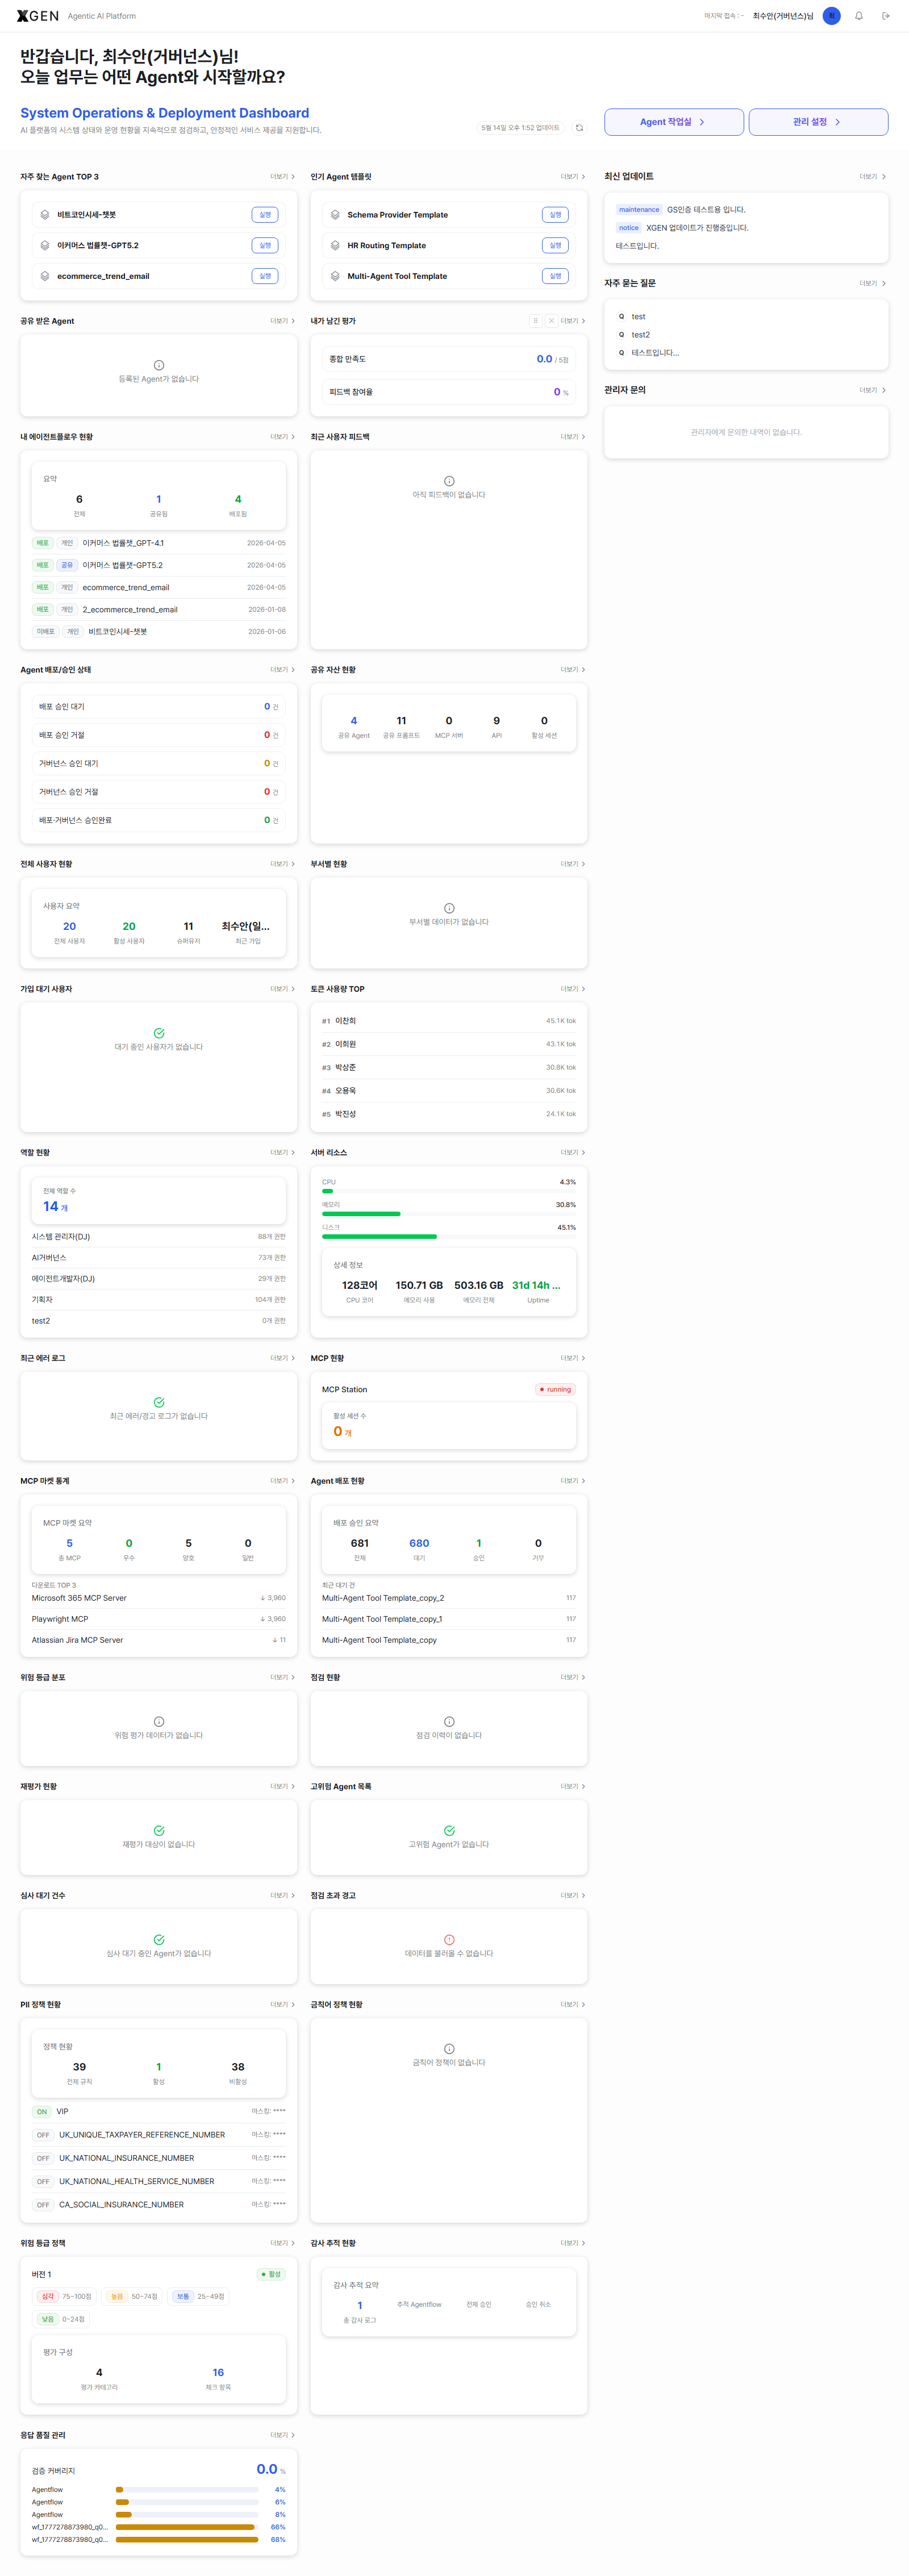
Operational Usage
- Daily approval-queue triage — Review new items in the main-screen Agent Approval Queue daily. Detailed review and approval happens in AI Governance - Risk Review.
- Verify policy reflection immediately after changes — After editing a risk-grade or forbidden-word policy, confirm the dashboard Risk Policy / Forbidden-Word Policy widgets update instantly. If they do not, suspect a cache or permission-sync issue.
- Shortcut entries — Click Admin Center and pick AI Governance from the left sidebar to edit policies.
Common Operational Issues
| Symptom | Cause / What to Check |
|---|---|
| Governance widgets are not visible | Confirm the account has admin.governance:* |
| Risk Policy widget shows "Inactive" | The policy itself is disabled. Use AI Governance to enable it |
| Forbidden-Word Policy widget shows 0 rules | New environment with no rules registered. Adding rules reflects automatically |
| Right-panel Admin Inquiries is empty | No new 1:1 inquiries from users (empty-state message: "No inquiries to the administrator yet.") |
| New admin sees a different widget layout | Widget settings are per-user. Guide them to Reset to start from default |
Related Chapters
- User Manual · Dashboard — layout fundamentals and widget customization (Standard User / Agent Developer views)
- AI Governance — risk review, inspection, audit, and control-policy menus
- Roles & Permissions — how to grant permissions like
admin.governance:*
Inquiries
For dashboard permission / widget visibility questions, email the Xgen Solution Administrator.